Regional House Prices – A Decade of Disparity
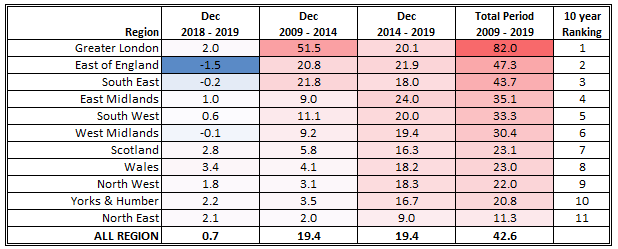
The table shows regional house price growth over the past 1, 5 and 10 year periods. In particular, we show the different changes in price experienced by the different regions over the 10 year period during which Greater London has seen the highest growth in prices. The East of England follows whilst the North East shows the lowest growth. Over the last five years all regions have seen prices rise, with East Midlands topping the league table, marginally ahead of the East of England. Over the last year, three regions, including the East of England, have seen prices fall, but Wales leads in terms of the most growth.